
Our approach in detail:
We apply accurate color measurements to create digital swatches, segment the categories by color and increase the scope of category analyses.
Measuring color and observe descriptors
We apply photopectrometric color measurement to get unique color values per product and observe additional product descriptors
Classification & Segmentation
We classify products based on measured color properties and build time stable market segments fully excluding human error
Build up a new Product Database
We create a new product database including colormetric values and the additional product attributes like limited edition, texture, gloss and metallic
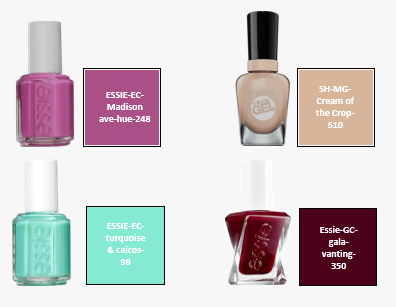
Create digital swatches from color values
We collect new products for color measurement, create digital swatches from measured values and update our product database
For more details on our approach please continue reading here or download our company broschure .

Color Measurement
Measuring Cosmetic Products
We measure the color of cosmetic products beginning with nail polish and how it is perceived by the human eye. From this color measurement, we are able to obtain the product´s color value and its gloss index. To achieve this, we apply spectrophotometric reflectance measurement methods using a 45°/0° geometry as recommended by CIE (International Commission on Illumination).
Color Measurement
LAB Color Space
We measure the product colors in CIELAB color space (LAB Color Space) which was originally designed to approximate human vision. By applying the CIE standard illuminant D65 and a 10° standard observer we obtain {L*,a*,b*} color values for every product. The lightness L* ranges from black (L* = 0) to bright white (L* = 100). Both color channels a* and b* show neutral grey values at a* = 0 and b* = 0. The a* axis ranges from red (positive a* values) to green (negative a* values) while the b* axis ranges from yellow (positive b* values) to blue (negative b* values). Image Source: Digitaler Farbatlas 5.0, DTP Studio Oldenburg.
Product Classification
Classification By Color Values:
Market segments like "nude" and "pink" or "red" and "bordeaux" are not well-defined, but overlay each other.
Subjective color perception and arbitrary decisions by product managers often lead to market segments which are not stable over time.
To reduce the impact of subjective perception and judgment we have developed a method to classify products according to their measured color values.
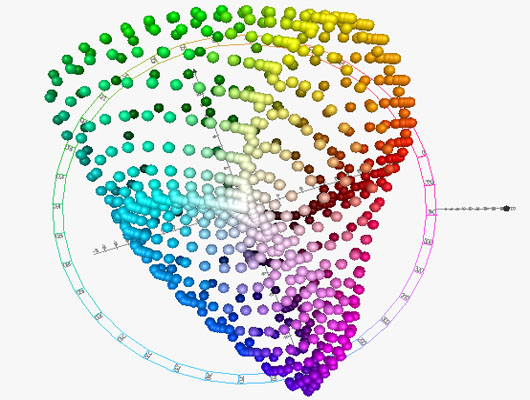
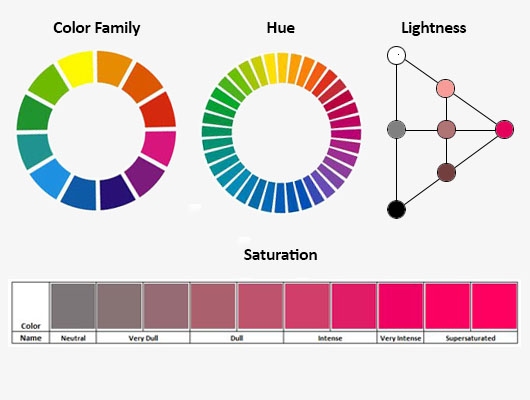
This approach allows us to segment the category into 12 color families, 36 hues, six saturation* and three lightness clusters. Image based on (CIE LAB Circle).
Subjective color perception and arbitrary decisions by product managers often lead to market segments which are not stable over time.
To reduce the impact of subjective perception and judgment we have developed a method to classify products according to their measured color values.
This approach allows us to segment the category into 12 color families, 36 hues, six saturation* and three lightness clusters. Image based on (CIE LAB Circle).
Category Segmentation
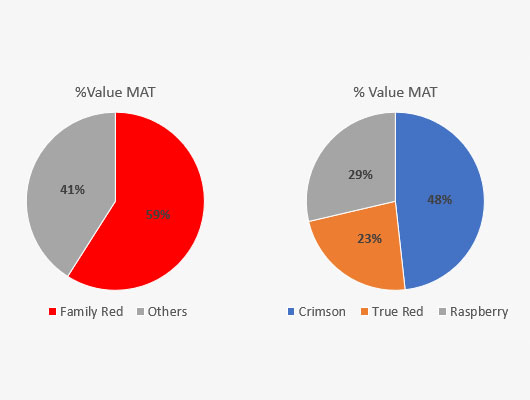
Segmentation By Color:
With our segmentation process, we can slice and dice the category by color. We can detect the most important color families, the priority of hues within each family and finally reveal the most valuable combination of hue, saturation and lightness.
Knowing the value proportions of color families or hues can provide guidance on your where-to-play choices, serving as a starting point for assortment gap analyses and assisting you with space allocation exercises.
Knowing the value proportions of color families or hues can provide guidance on your where-to-play choices, serving as a starting point for assortment gap analyses and assisting you with space allocation exercises.
Product Database Built-Up
Improved Product Database:
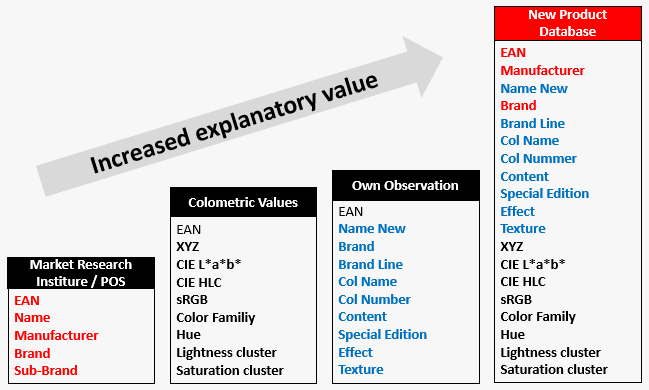
We have built-up a comprehensive category database: including basic SKU information (EAN, Name, Manufacturer, Brand, Sub-Brand) adding additional attributes from own observations (Product line, Color Number, Color name, Content, Special Edition, Effect, Texture), all colorimetic values such as (XYZ, L*a*b, LCh, sRGB) and finally a classification by hue, saturation and lightness: resulting in a strong product database for Nail, Lip and Face with increased value vs. existing product segmentations.
Creation Of Digital Swatches
Transforming Color Values Into Digital Swatches:
We have developed a method to create a digital swatch from previously measured color values and bring it into Microsoft Excel to combine it with your offtake data. The minute digital swatches are in your Excel report, you can benefit from Microsoft Excel´s analytical strength by applying Sort and Filter to the data, including all product colors.
This will provide immediate answers to most of your questions on product performance.
* In this Webseite we use the more intuitive expression "Saturation" in favor of "Chroma".